Best chart & visualization Gutenberg block plugins 2021
We recently did a large website for a government agency that needed to show charts in their articles. Here we share the result of the deep dive we did to find the optimal solution.

Share
Summary
These are the plugins we found to be the best and would rate all three with ⭐⭐⭐⭐⭐:
They do however have different in features that you need to consider. Below is a short summary of the pros and cons of each.
Vizblock (our pick 👍)
This seems like the most recent and ambitious project. We ended up using it since it allows for multiple datasets for a chart (which was a must for our client). It is a premium only plugin, but you get good support and a plugin you know will be actively maintained. They also show a new feature list that looks very promising. We lacked the capability to pick custom colors – but other then that it was definitly the most feature rich plugin.
Pros
- A lot of features
- Upload CSV & table editor
- Multiple datasets in the same chart
- Interactive (toggle data points)
- Best looking
- Title & footnote
- Bar chart, horizontal bar, stacked bar chart, line chart, area chart, donut chart, pie chart.
- Hide/show markers
- Hide/show axis and grid lines
- Good looking marker info boxes
Cons
- Premium only
- Current release gives no option for colors
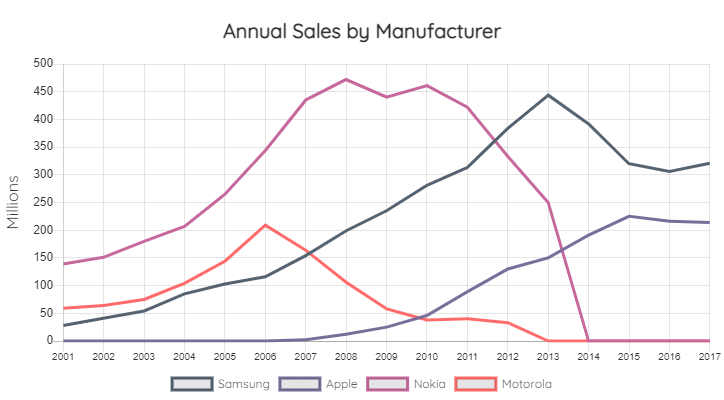
Live demo of a line chart with Vizblock
Charts Blocks for Gutenberg
wordpress.org/plugins/charts-blocks/
This plugin is a great option if you are just looking to make a simple chart. It is 100% free, the chart looks great and are easy to use. However, it doesn’t allow you to upload several data points, e g you can only have 1 line in a line chart (will be a deal breaker for a lot of you). You do not get any custom features – there are basically no customizations – but if you don’t need them, this is the plugin for you. The plugin is based on the popular chart.js library.
Pros
- 100% free (WordPress repo)
- Simple to use
- Custom colors for each datapoint
- Same chart types as Vizblock above
Cons
- Upload CSV only (no inline table)
- No updates since first release
- Only 1 dataset (e g line charts can only have 1 line)
- No customizations
Live demo of a line chart with Charts Blocks for Gutenberg
Planet Charts
Planet Charts is a premium only plugin that is bought on the Codecanyon market. It has been around the longest and is probably the most stable. It has some more charts then the other two (like radar diagram). It offers a lot of the features that Vizblock has, except for toggling between multiple datasets. It does not look good out of the box, but it does offer you some more styling options in the editor (like colors and font sizing).
Pros
- More charts
- Lots of features
- Seems very stable
- Codecanyon market quality control
- Color theming
Cons
- Premium only
- Not as good looking
Demo of line chart with Planet Charts
Let us know
Let us know if you have any other chart blocks we should test out! Hope this little summary helped. We can be reached at hello@wpblockz.com.